译者:汪立
时间:2008年1月18日
博客地址:
http://blog.csdn.net/lee576/原作者:ASP.NET之父
*********************************************************************************************************************
A few weeks ago I blogged about the new JavaScript Intellisense support in VS 2008.
几星期前我在博客上发表一篇文章-VS 2008 对JavaScript的智能感应支持
One of the other JavaScript features that I'm sure will be popular in VS 2008 is the much-improved support for JavaScript debugging. This is enabled in both the free Visual Web Developer 2008 Express edition as well as inVisual Studio, and makes using JavaScript and building AJAX applications significantly easier.
我非常确定的是另一个在VS 2008中将会大受欢迎的JavaScript特性:大幅改进的对JavaScript调试的支持.这也是免费的Visual Web Developer 2008 Express版本所拥有的特性,并且该特性在实际意义上使得使用JavaScript和构建AJAX程序变得更简单了
Setting JavaScript breakpoints inASP.NET pages
在ASP.NET页面设置JavaScript断点
One of the annoying things with VS 2005 is that you have to first run your ASP.NET pages before you can set JavaScript breakpoints in them in the debugger.
在VS 2005中一件让人恼火的事是你在调试器中设置JavaScript断点时,你必须先运行你的ASP.NET程序
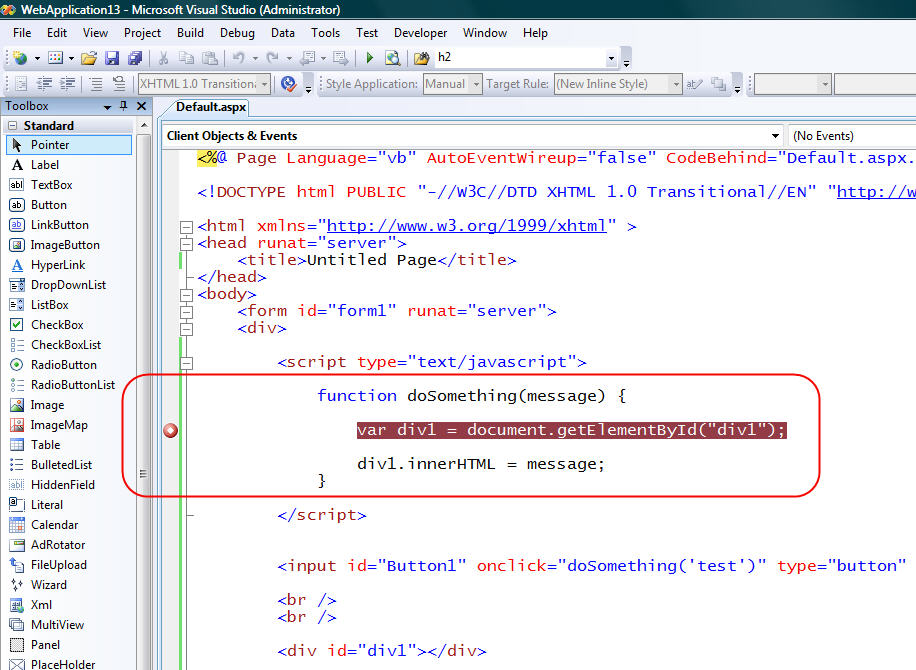
VS 2008 makes this much better by adding new support that allows you to set client-side JavaScript breakpointsdirectly within your server-side .aspxand .master source files:
VS 2008 在这一点上做的好多了,它增加了新的支持,你可以直接在你的.aspx和.maste源文件里面设置JavaScript断点
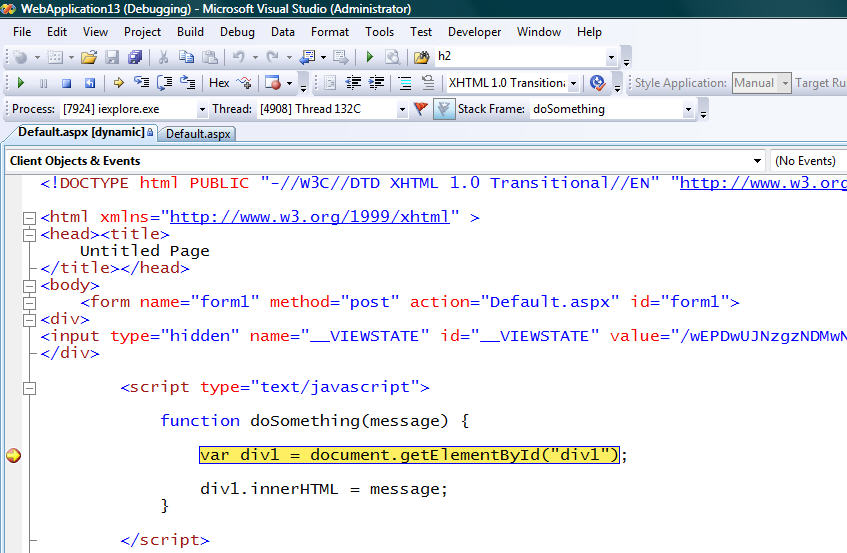
When you set a breakpoint in your .aspx page like above, VS 2008 will automatically map the breakpoint location to the dynamically generated client HTML that runs in the browser when the page is later executed:
当你像上图那样设置断点,VS 2008将会自动映射到浏览器运行页面动态生成的客户端HTML断点处
If you add/remove/update the breakpoint locations in the running HTML document, VS 2008 is also now smart enough to perform the reverse mapping and update the breakpoint in the original .aspx or .master source file on the server. This makes it much easier to get into a nice edit/debug/edit/debug flow as you are iterating on your applications.
如果你在正在运行的HTML表单中添加/移除/更新断点位置,VS 2008也有足够的智能逆向映射更新在服务器端最初的.aspx和.maste源文件的断点,这使得你的程序很容易的进入到一个很漂亮的 反复 编辑/调试/编辑/调试 的流程中
Best of all, you can nowset both client-side JavaScript breakpoints and VB/C# server-side breakpoints at the same time (even in the same page) and use a single debugger to step through both the server-side and client-side code in a single debug session (which is extremely useful for any AJAX heavy application).
最佳的情况下,你能同时在客户端设置JavaScript断点和在服务器端设置断点(甚至是在同一个页面) 并且使用一个调试器在客户端及服务器端代码之间进行单步调试(这在大量使用AJAX的程序中是相当有用的)
Any JavaScript breakpoints you set will also now by default be saved by VS 2008 when you close the project/solution. When you open up the project again, the previous locations you set the breakpoints on will still have them enabled.
任何JavaScript断点设置在你关闭工程/解决方案的时候,在默认情况下都会被VS2008保存下来.当你再次打开项目,之前设置的断点位置仍然可用
Script Document Navigation within the Solution Explorer
在解决方案浏览器中进行脚本文件导航
Often the JavaScript that is sent down to a browser client is dynamically generated on the server (for example: with scripts that arestored as resources within compiled server controls - like ASP.NET AJAX UpdatePanels andcontrolextenders). In scenarios such as these, you want to be able to easily see all JavaScript URLs being loaded from a page, as well as step intothe within thedebugger.
通常JavaScript是在服务器端动态生成之后下发到浏览器客户端(举个例子:存储在编译后的服务器控件里的脚本资源-就像是AJAX UpdatePanels 和一些扩展控件),在这样的特定情节之下,你需要能更容易的从页面那看到所有加载的JavaScript URLs,又能进入到调试器中
VS 2008 makes it much easier to-do this by integrating the running Script Document feature (that in VS 2005 was a separate tool-pane window) into the VS 2008 solution explorer view when you are debugging a web application.
当你调试web程序时,VS 2008 使用整合运行中的脚本文件特性(这在VS 2005中是一个分离的工具条窗口)到解决方案视窗中,使之更为简单容易
Specifically, when you are using VS to run and debug a page, VS 2008 will now list all of the script URLs that thepage you are debugging has loaded in the browser at the top of your VS solution explorer pane:
特别是,当你使用VS运行和调试页面时, VS 2008会在解决方案浏览器上列举所有你正调试并运行在浏览器中的script URLs 页面
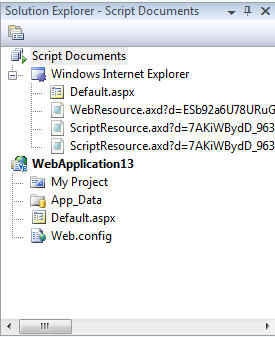
You can then double click on any of the URLs under the "Script Documents" node at the top to see the JavaScript filethat was loaded in the page:
这时你可以双击"Script Documents"结点下任意一个URLs,在顶部你可以看到已在页面中运行的JavaScript文件
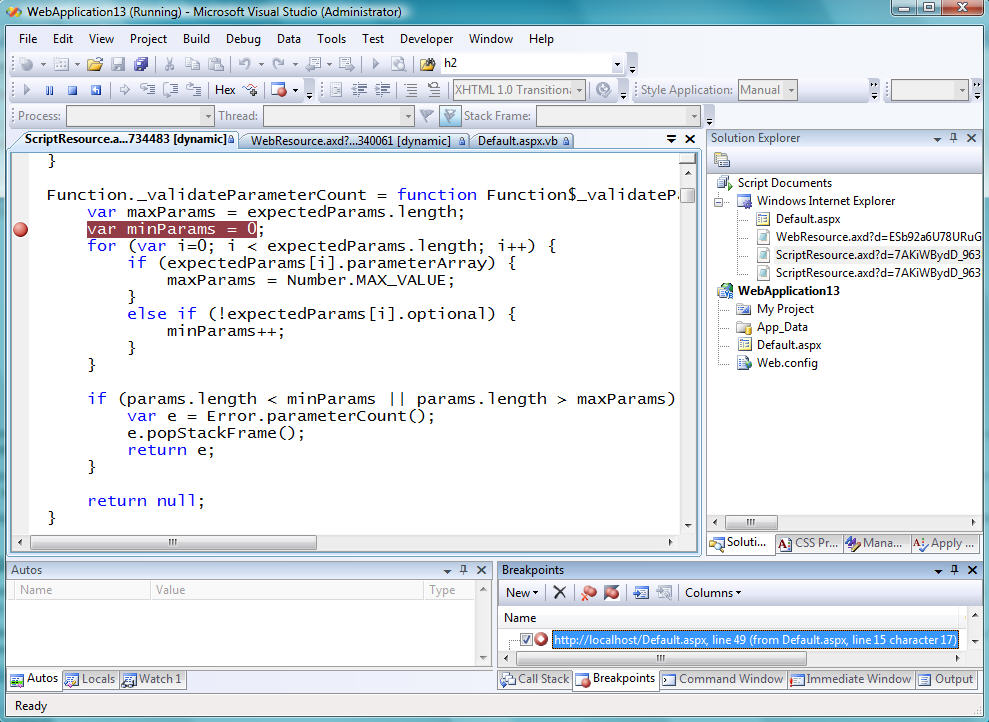
You can obviously then set breakpoints in the loaded JavaScript and debug everything.
你可以很显而易见的在运行的JavaScript中设置断点和调试任何东西
Much Richer Debug Watch/Locals and Visualizer Support
更强大的调试监控/定位和观察器支持
Easily opening and navigatingJavaScript files in the debugger is nice - but the real meat of the improvements made with VS 2008 JavaScript debugging is in the much improved object execution and inspection support. When you inspect a variable within the debugger using VS 2008, you'll find much more detailed object information is now available:
容易地打开和导航JavaScript文件是不错的-但VS 2008 JavaScript调试真正改进的内容是,大幅改进的对象执行和观察支持.当你通过VS 2008观察调试器中的一个变量,你会发现观察该对象更多的细节信息现在已成为可能
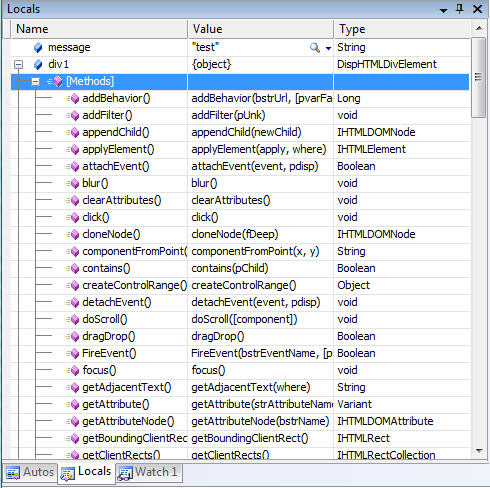
You can now browse runtimeobject methods:
你可以浏览运行时的对象方法
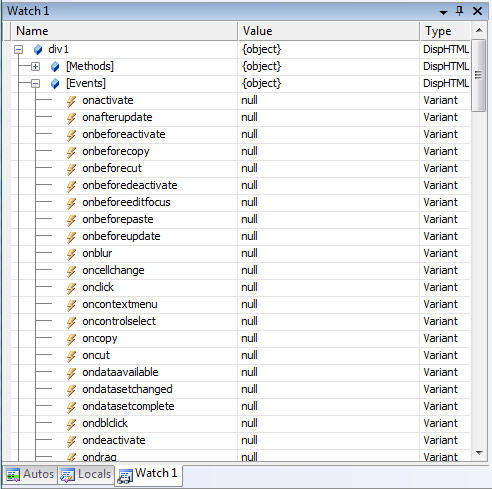
You can now browse runtime object events:
你可以浏览运行时的对象事件
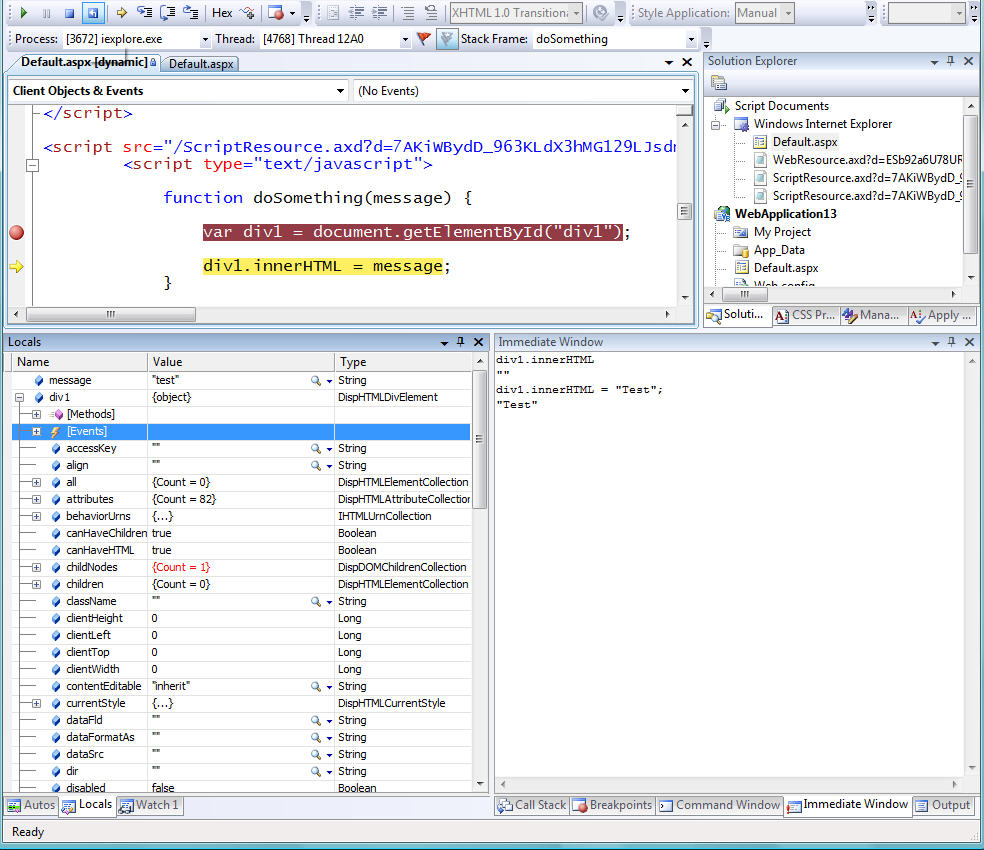
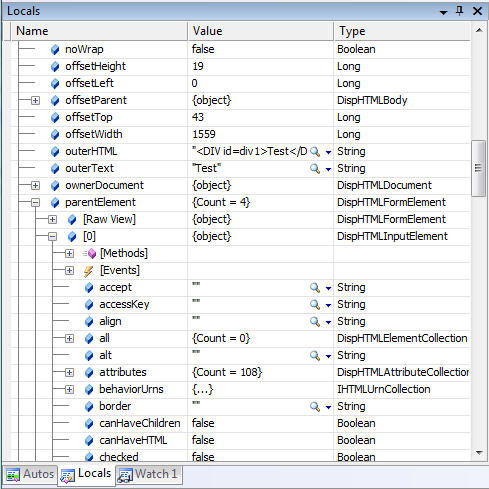
And younow get much, much more detailed property and property type information of running objects. Note below how I am traversing the div element's "parentElement" property to dynamically look up details about the element's parent HTML element andoverall position within the HTML DOM:
并且你还可以从运行的对象中得到更多更多属性的细节和属性类型信息.下面注意看我怎么通过div元素的"parentElement"属性去动态查看在HTML DOM中元素的父HTML元素的详细信息和全部位置
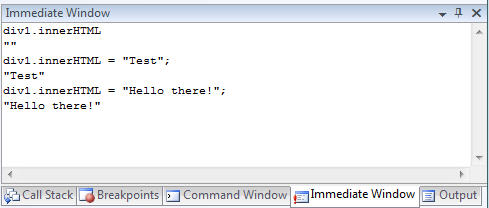
You can obviously use the debugger property grid above to both lookup as well as set values. You can also run code in the immediate window to retrieve and change JavaScript at runtime:
你可以很显而易见的使用调试器上面所有的属性表格,同时设置它们的值.在运行时,在"immediate window"运行代码,重新得到和改变JavaScript
VS 2008 also provides support for pluggable debug visualizers that you can use with JavaScript debugging. This enables developers to add extensions to the debugger that can work against running objects and provide richer visualization views of them. For example, we could use the built-in "Text", "XML", or "HTML" visualizer to load a dialog to better inspect a value:


I suspect we might see a cool CodePlex project providing nice JSON and REST JavaScript visualizers soon.
Summary
The above walkthrough hopefully provided a good overview of some of the new JavaScript debugging features coming soon. There are many more JavaScript and AJAX features coming in VS 2008 and .NET 3.5 that I'll be covering in future blog posts.
Note that because of the newVS 2008 multi-targeting support, you can use the JavaScript debugging features above with both ASP.NET applications built using .NET 3.5 (which also now has ASP.NET AJAX built-in), as well as with existing ASP.NET 2.0 applications(including ones thatuse the separate ASP.NET AJAX 1.0 download).This, combined with thenew VS 2008 JavaScript intellisense support,provides a very compelling reason to start using VS 2008 - even if you are using it to onlytarget .NET 2.0 applications.
Hope this helps,
Scott
P.S. To learn more about VS 2005 JavaScript Debugging, please read this blog post. Dan Wahlin also recently posted a nice set of AJAX testing and debugging tools that I recommend checking out here.
分享到:


相关推荐
VS 调试 JavaScript.txt
vs2003 Javascript调试工具
js调试工具,javascript调试工具
好用的javascript调试工具,方便进去js编写调试。
IE的JavaScript调试工具,感觉还行
即将推出的新的VS Code JavaScript调试器。 此扩展程序可调试Node.js和Web应用程序(在Edge和Chrome中),最终将成为VS Code的内置调试器。 即将推出的新的VS Code JavaScript调试器。 此扩展程序可调试Node.js和Web...
jsdt_JavaScript 调试工具
索引访问 用vs.net调试javascript 1,首先,要让你的ie允许调试脚本,具体步骤如下: 打开ie->工具菜单->inter选项->高级选项卡->去掉“禁止脚本调试"选项 2,打开vs.net,创建一个新的asp.net项目(或打开一个) 3,运行...
JS调试包.rarJS调试包.rarJS调试包.rarJS调试包.rarJS调试包.rarJS调试包.rarJS调试包.rarJS调试包.rarJS调试包.rarJS调试包.rarJS调试包.rarJS调试包.rarJS调试包.rarrarJS调试包.rarrarJS调试包.rarrarJS调试包....
js程序的调试是相当郁闷的,很多错误是无法控制的,在没有什么好的调试工具那是更加麻烦的,现在的情况比以前稍好,在Firefox下还有firebug,这的确是一个不错的js调试工具,但在IE下使用就很麻烦,而且效果很不好,...
如何使用chrome自带的Javascript调试工具
JavaScript调试 (告别alert())
enkman是一款历史非常悠久的JavaScript调试器,从最初Netscape/Mozilla时期,Venkman就力图为Mozilla系列浏览器提供JavaScript调试功能。现在基本能够运行在所有Mozilla家族的产生平台上。 现在,在扩展中心中,...
在firefox中调试javascript的详细步骤说明
大家在开发网页时,JavaScript调试一直比较苦脑。今天放出来这个插件,方便大家调试自己的JS。安装后,打开IE,点工具菜单,选Internet选项,再点高级选项卡,在里面去掉禁用脚本调试(Internet Explorer)的小勾,...
Visual Studio 2008, JavaScript 调试
1.对IE浏览器的调试 2 1.1. IE6,IE7浏览器对JS的调试方式 2 1.1.1准备工作 2 1.1.2调试脚本步骤 3 1.1.3总结 4 1.2.IE8浏览器对JS的调试方法 4 1.2.1.准备工作 4 1.2.2调试脚本步骤 5 1.2.3总结 8 2对火狐进行调试 8...
让JavaScript调试变得简单
Javascript调试,firefox插件,直接用Firefox打开安装
原创,能够即时调试html,css,javascript的工具。